No one can hold the full picture of a community’s behaviours, sentiments and activities. Relational maps help everyone recognise and agree on their shared story.
The collective intelligence gathered in the initial workshop produces a large and complex map ready for deeper analysis and pattern spotting.
In order to interrogate the map and draw out its insights, we create Views that are ready to share immediately after the map is created - these will have been designed with our commissioning partner before the community is engaged in the mapping itself.
We know exactly what views of the network will be most useful to the aims of the community, because we’ve spent time making sure that the data we gather and the Views we produce answer the exact questions and stories the community needs to convene around.
Read on for some examples of the insights we gather from relational maps:
Understanding the flows of referrals and resourcing to support stretched providers
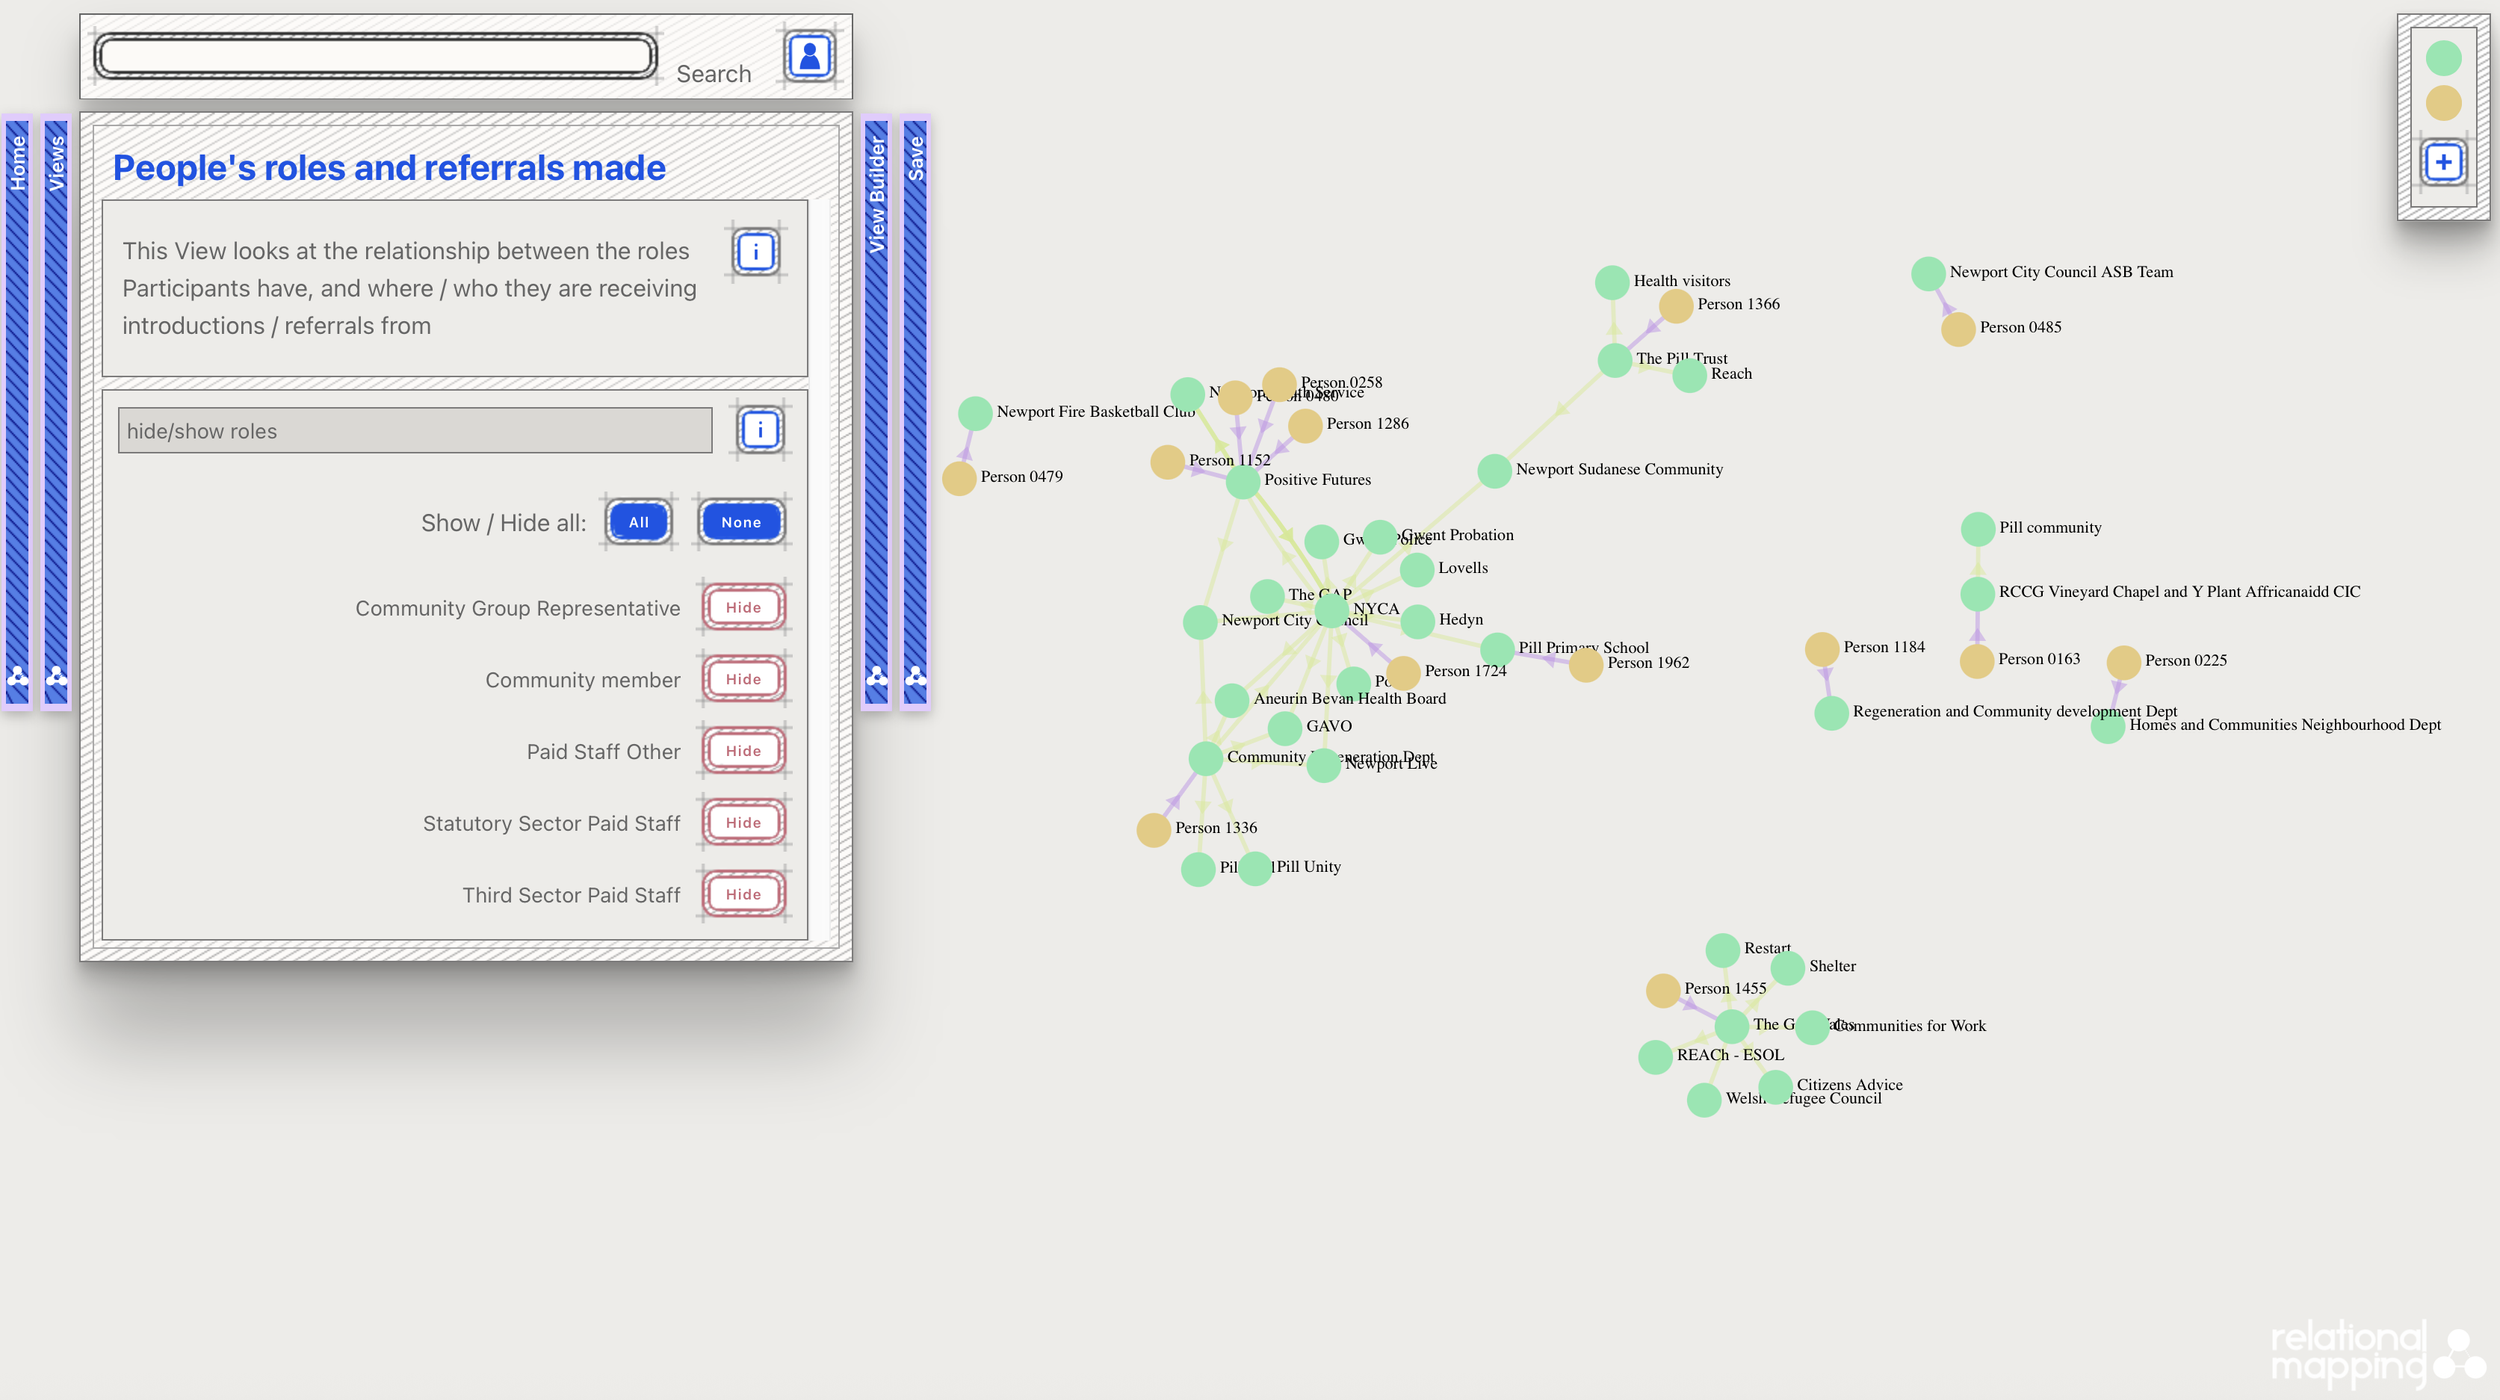
This community had a very specific set of questions about how referrals and resourcing were flowing across the network, and whether there was a fair balance across the public sector and the grassroots.
To look at this, we created a View with coloured connection links to indicate the direction of the referral, and a set of filters to look at the different roles of those referring or being referred to.
This enabled an honest conversation in that community about who was holding up different parts of the system without corresponding funding levels, and in answer to that they are working to build better support and resourcing.
Revealing the actual patterns of peer support
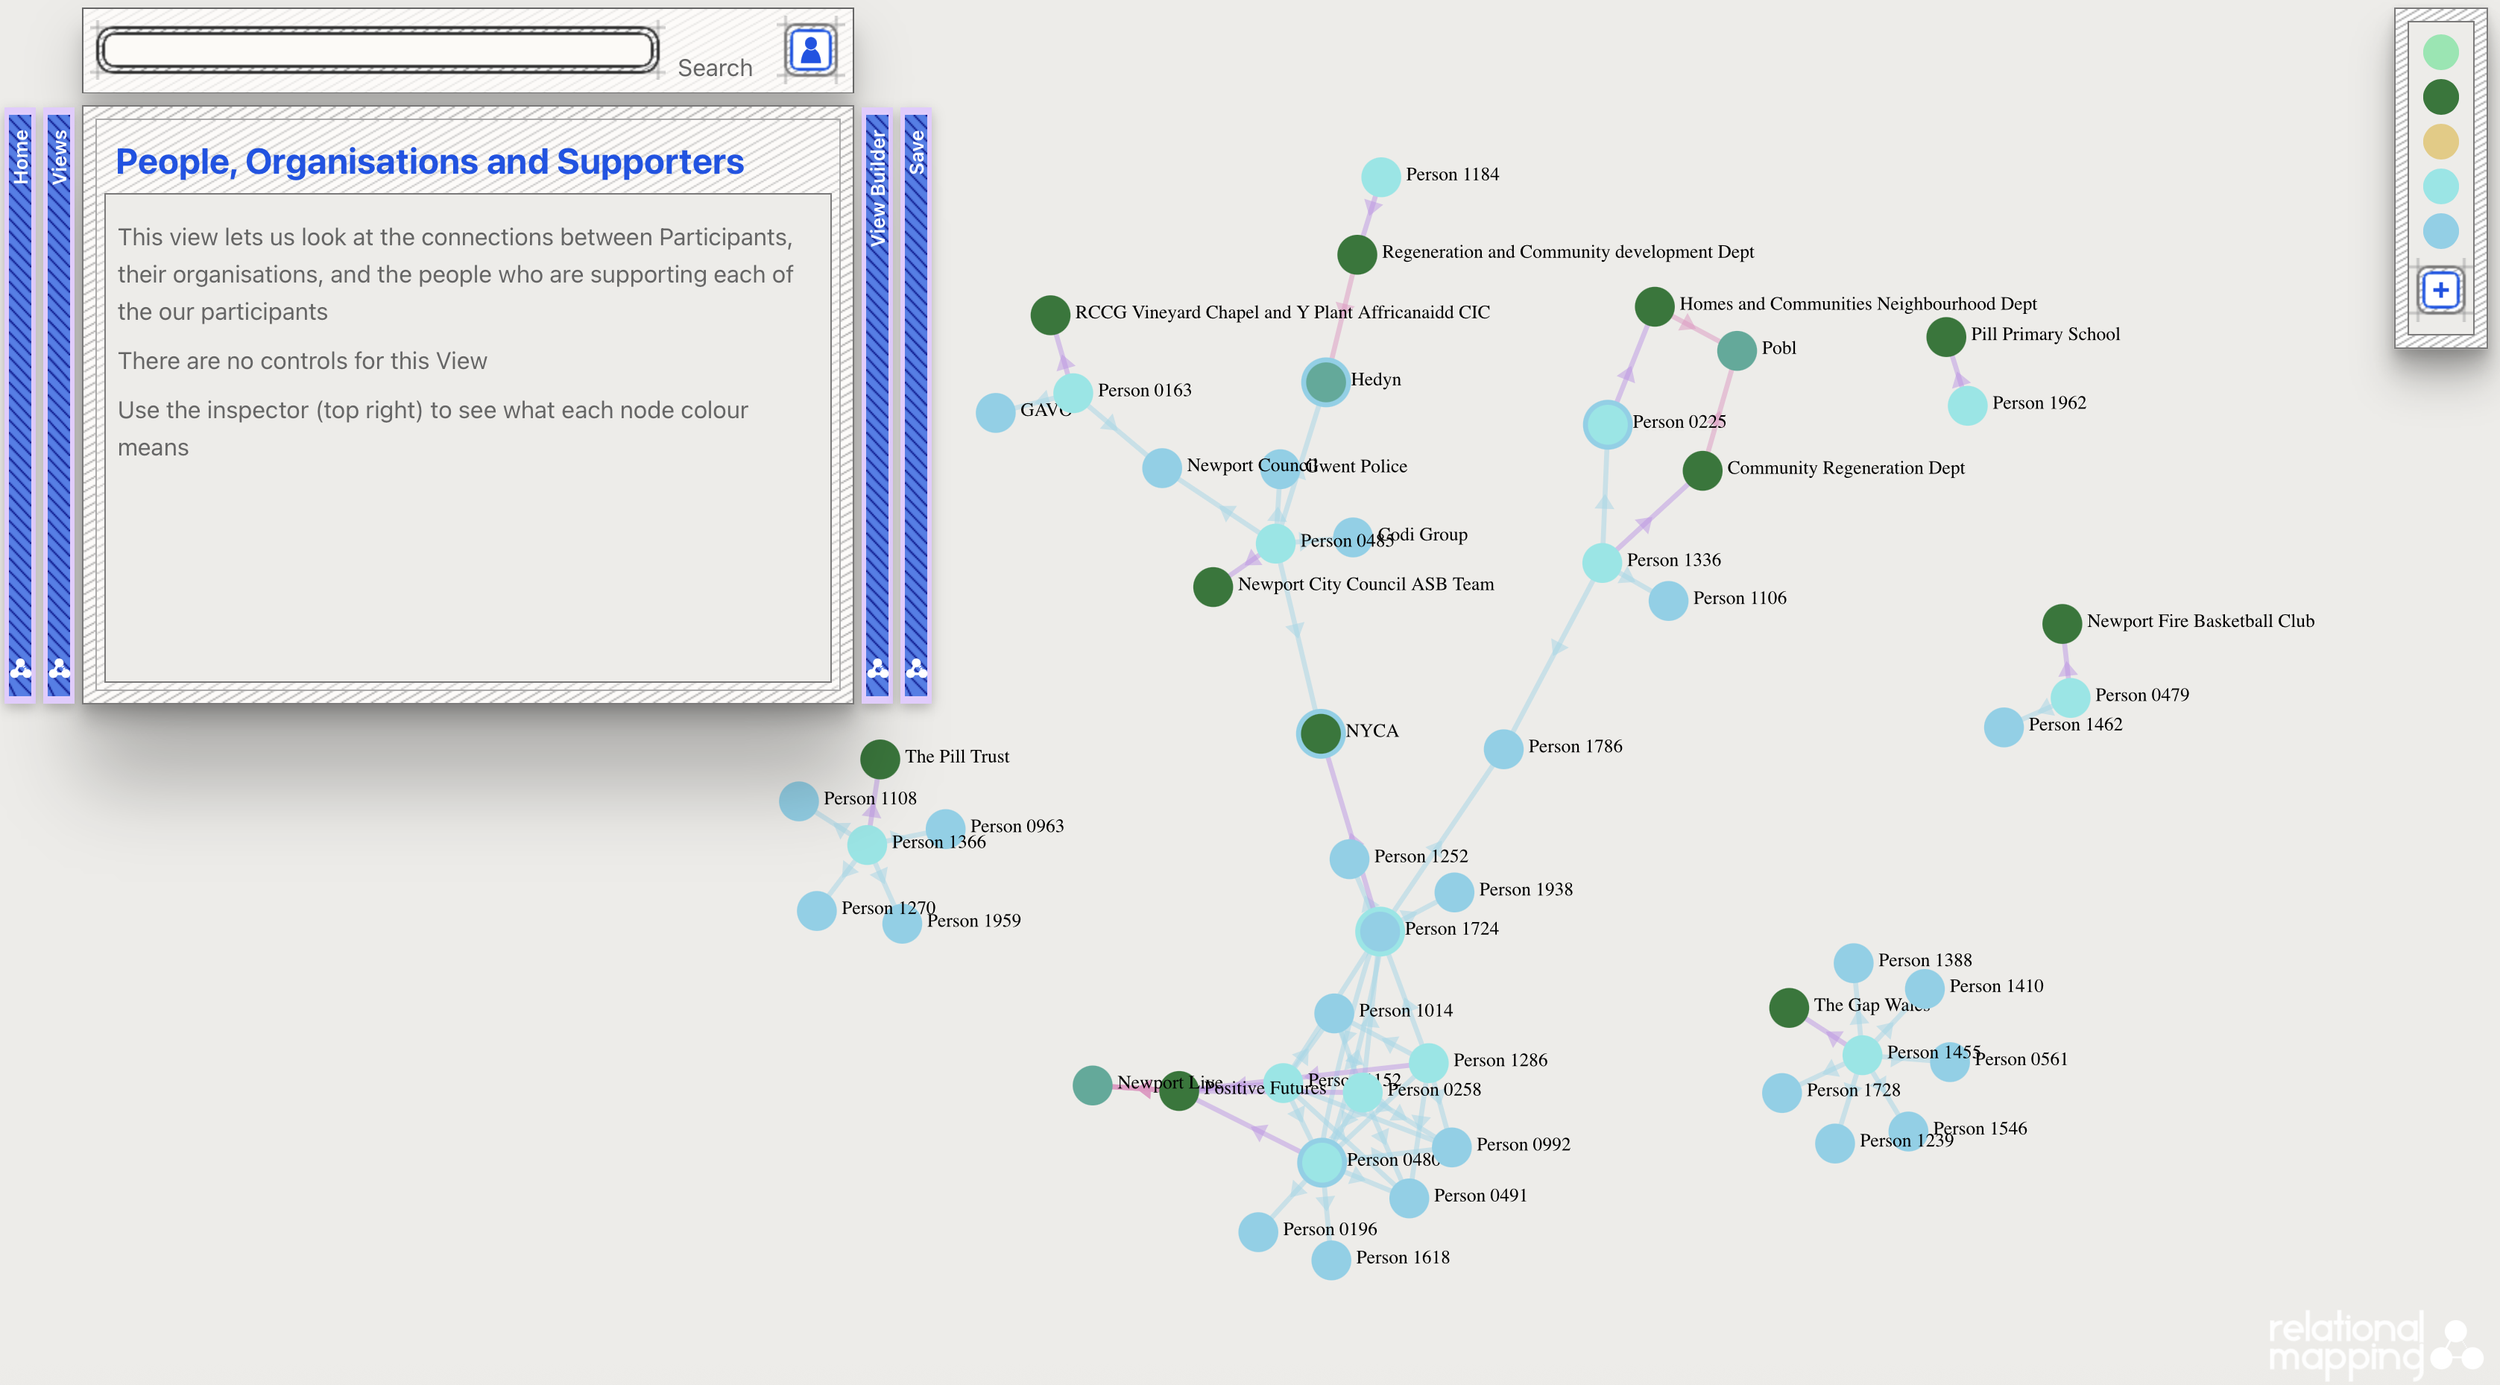
In this project, we made a View of the participating organisations, the people that were responding for the organisations, and their ‘Supporters’
To gather the relational network of Supporters, we asked: ‘who are your main supporters? People you might call when you need someone to back you up in a tricky situation?’
For this particular set of respondents, there was a dense network of peer support in just one part of the community. Everyone else was fairly isolated. Looked at in tandem with a different View and conversations with the community, we were able to see where values and purpose indicated where new Supporters could be connected to, which is now part of the longer term resilience building of this community.
Surfacing hidden clusters of collaboration
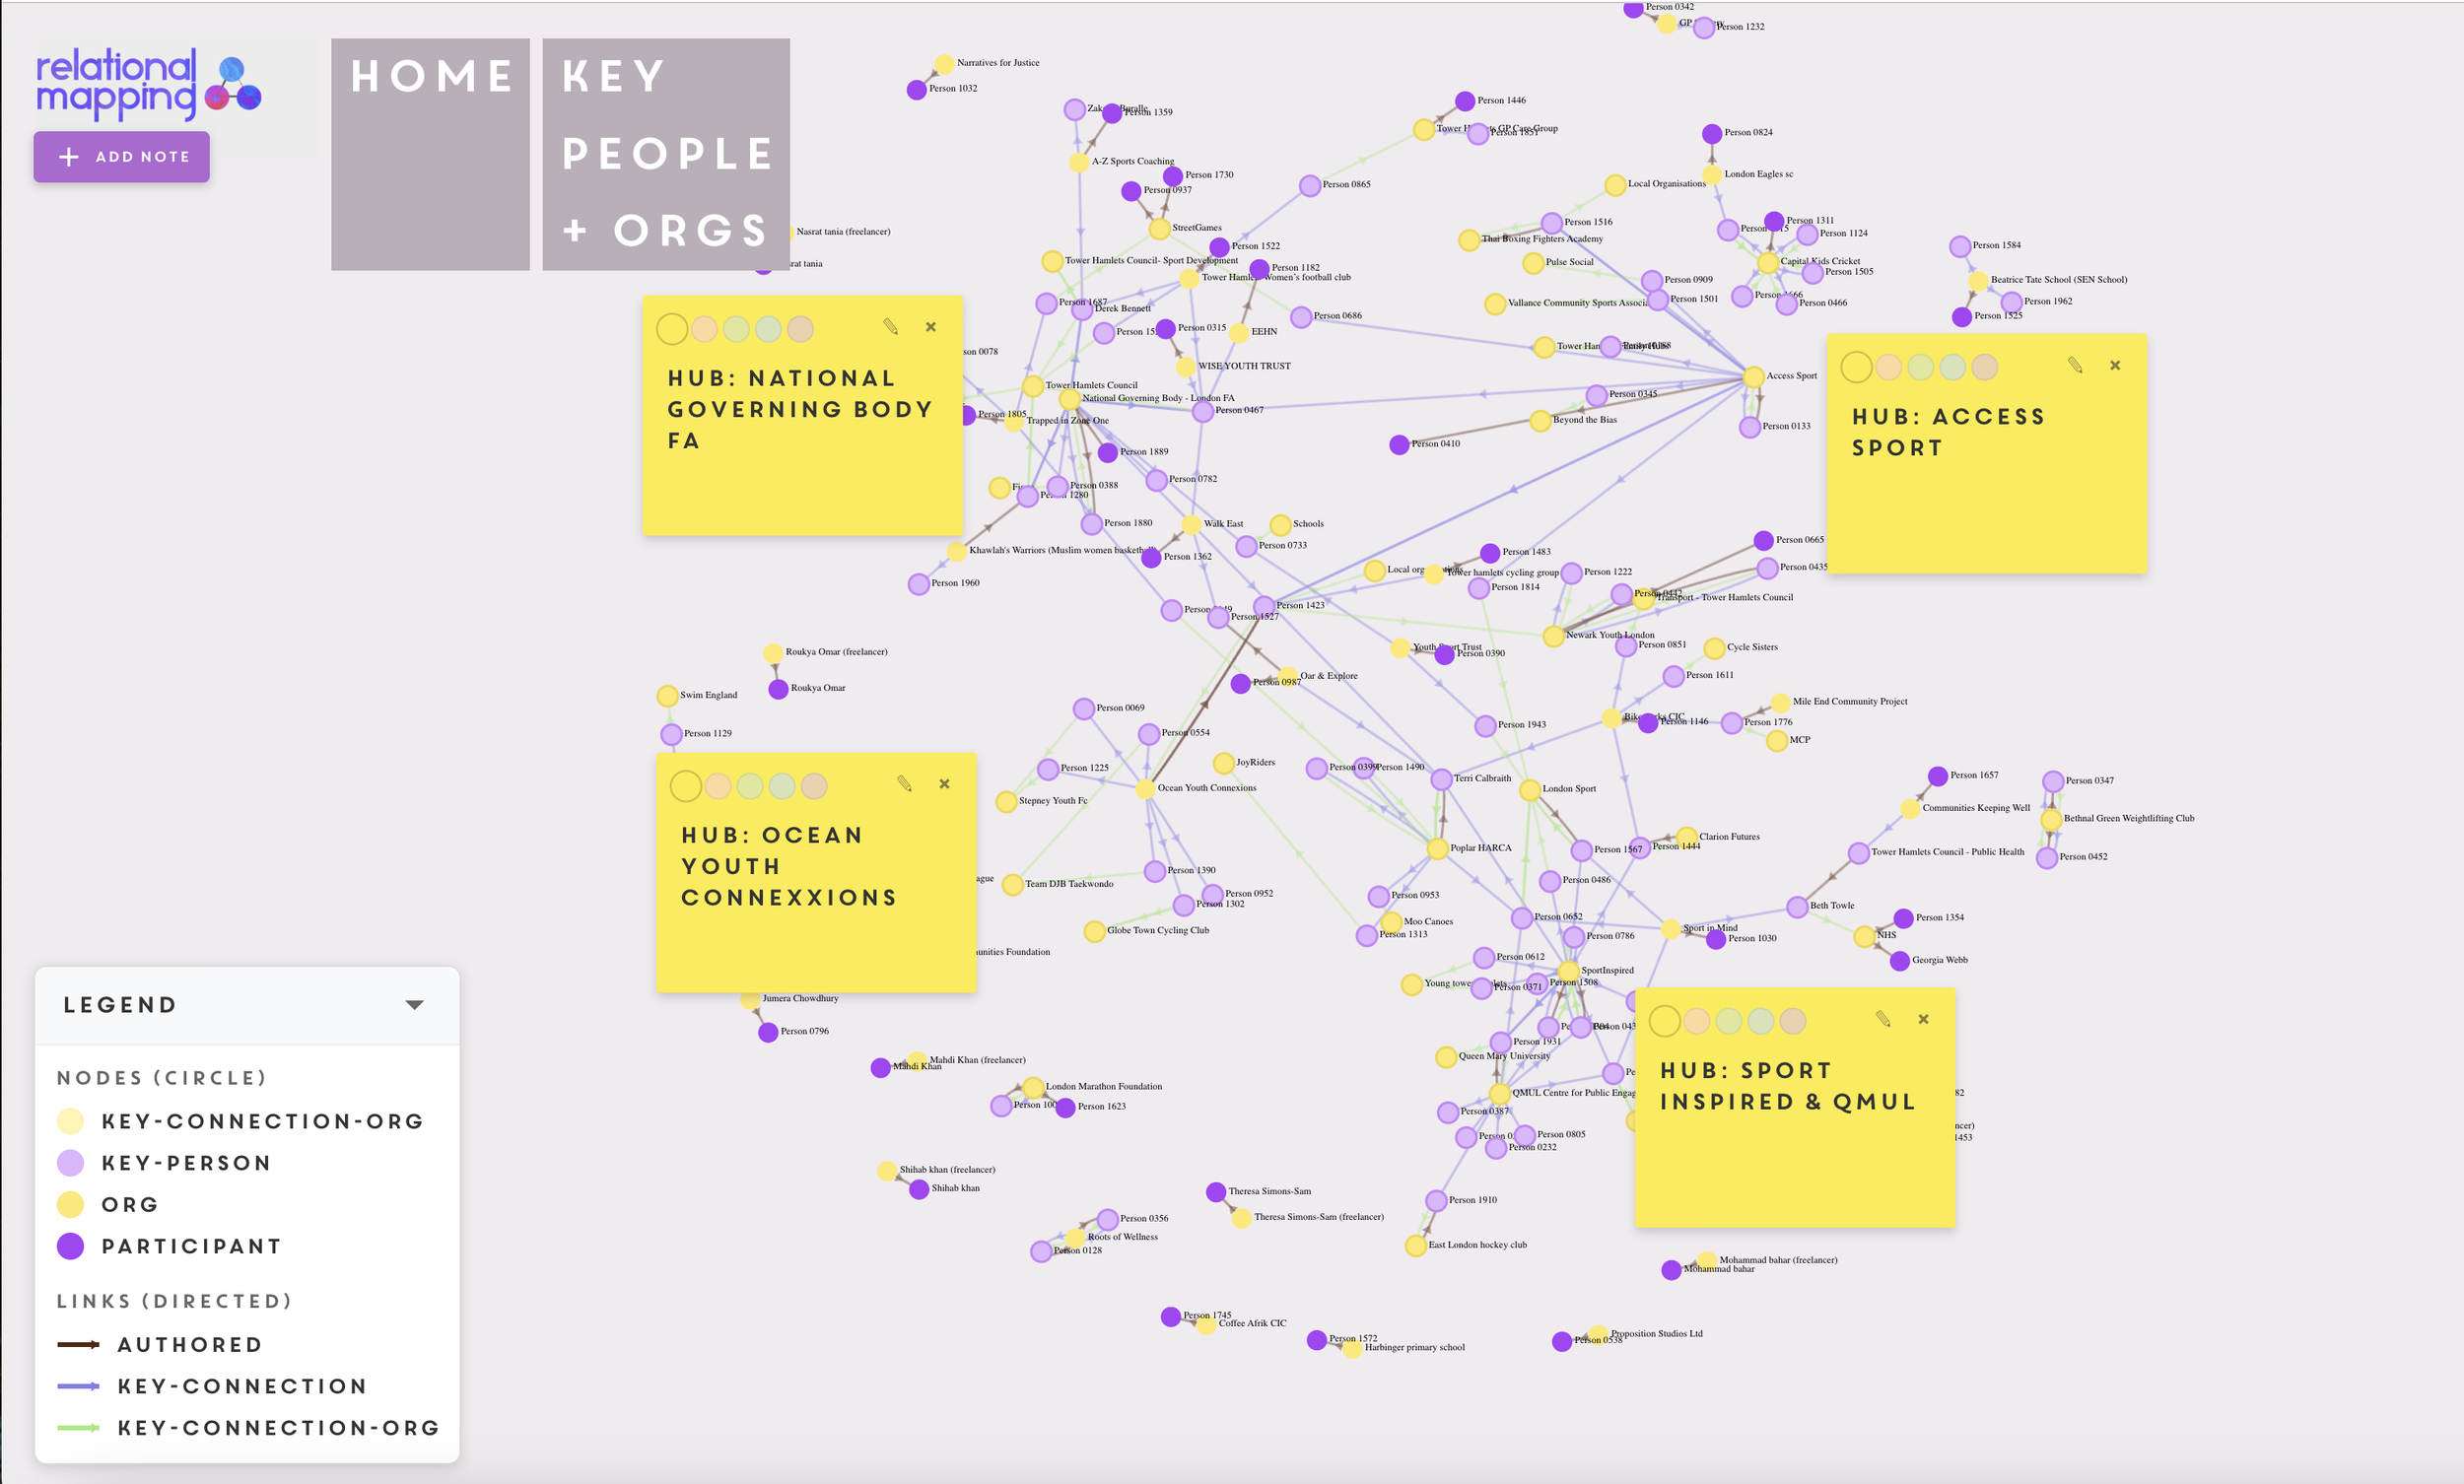
In this project, we made a View of the participating organisations and their ‘Key People’ only.
This View revealed a clear pattern of four distinct hubs of relationships, only loosely connected together. We were able to validate this with other Views and conversations with the community that substantiated our understanding of how and why these organisation clusters were forming specific loci of activity.
As well as revealing the network pattern, this View indicates where to build connections between these hubs to stop energy and resources dropping off unnecessarily.
Strategically distributing provisions across demographics
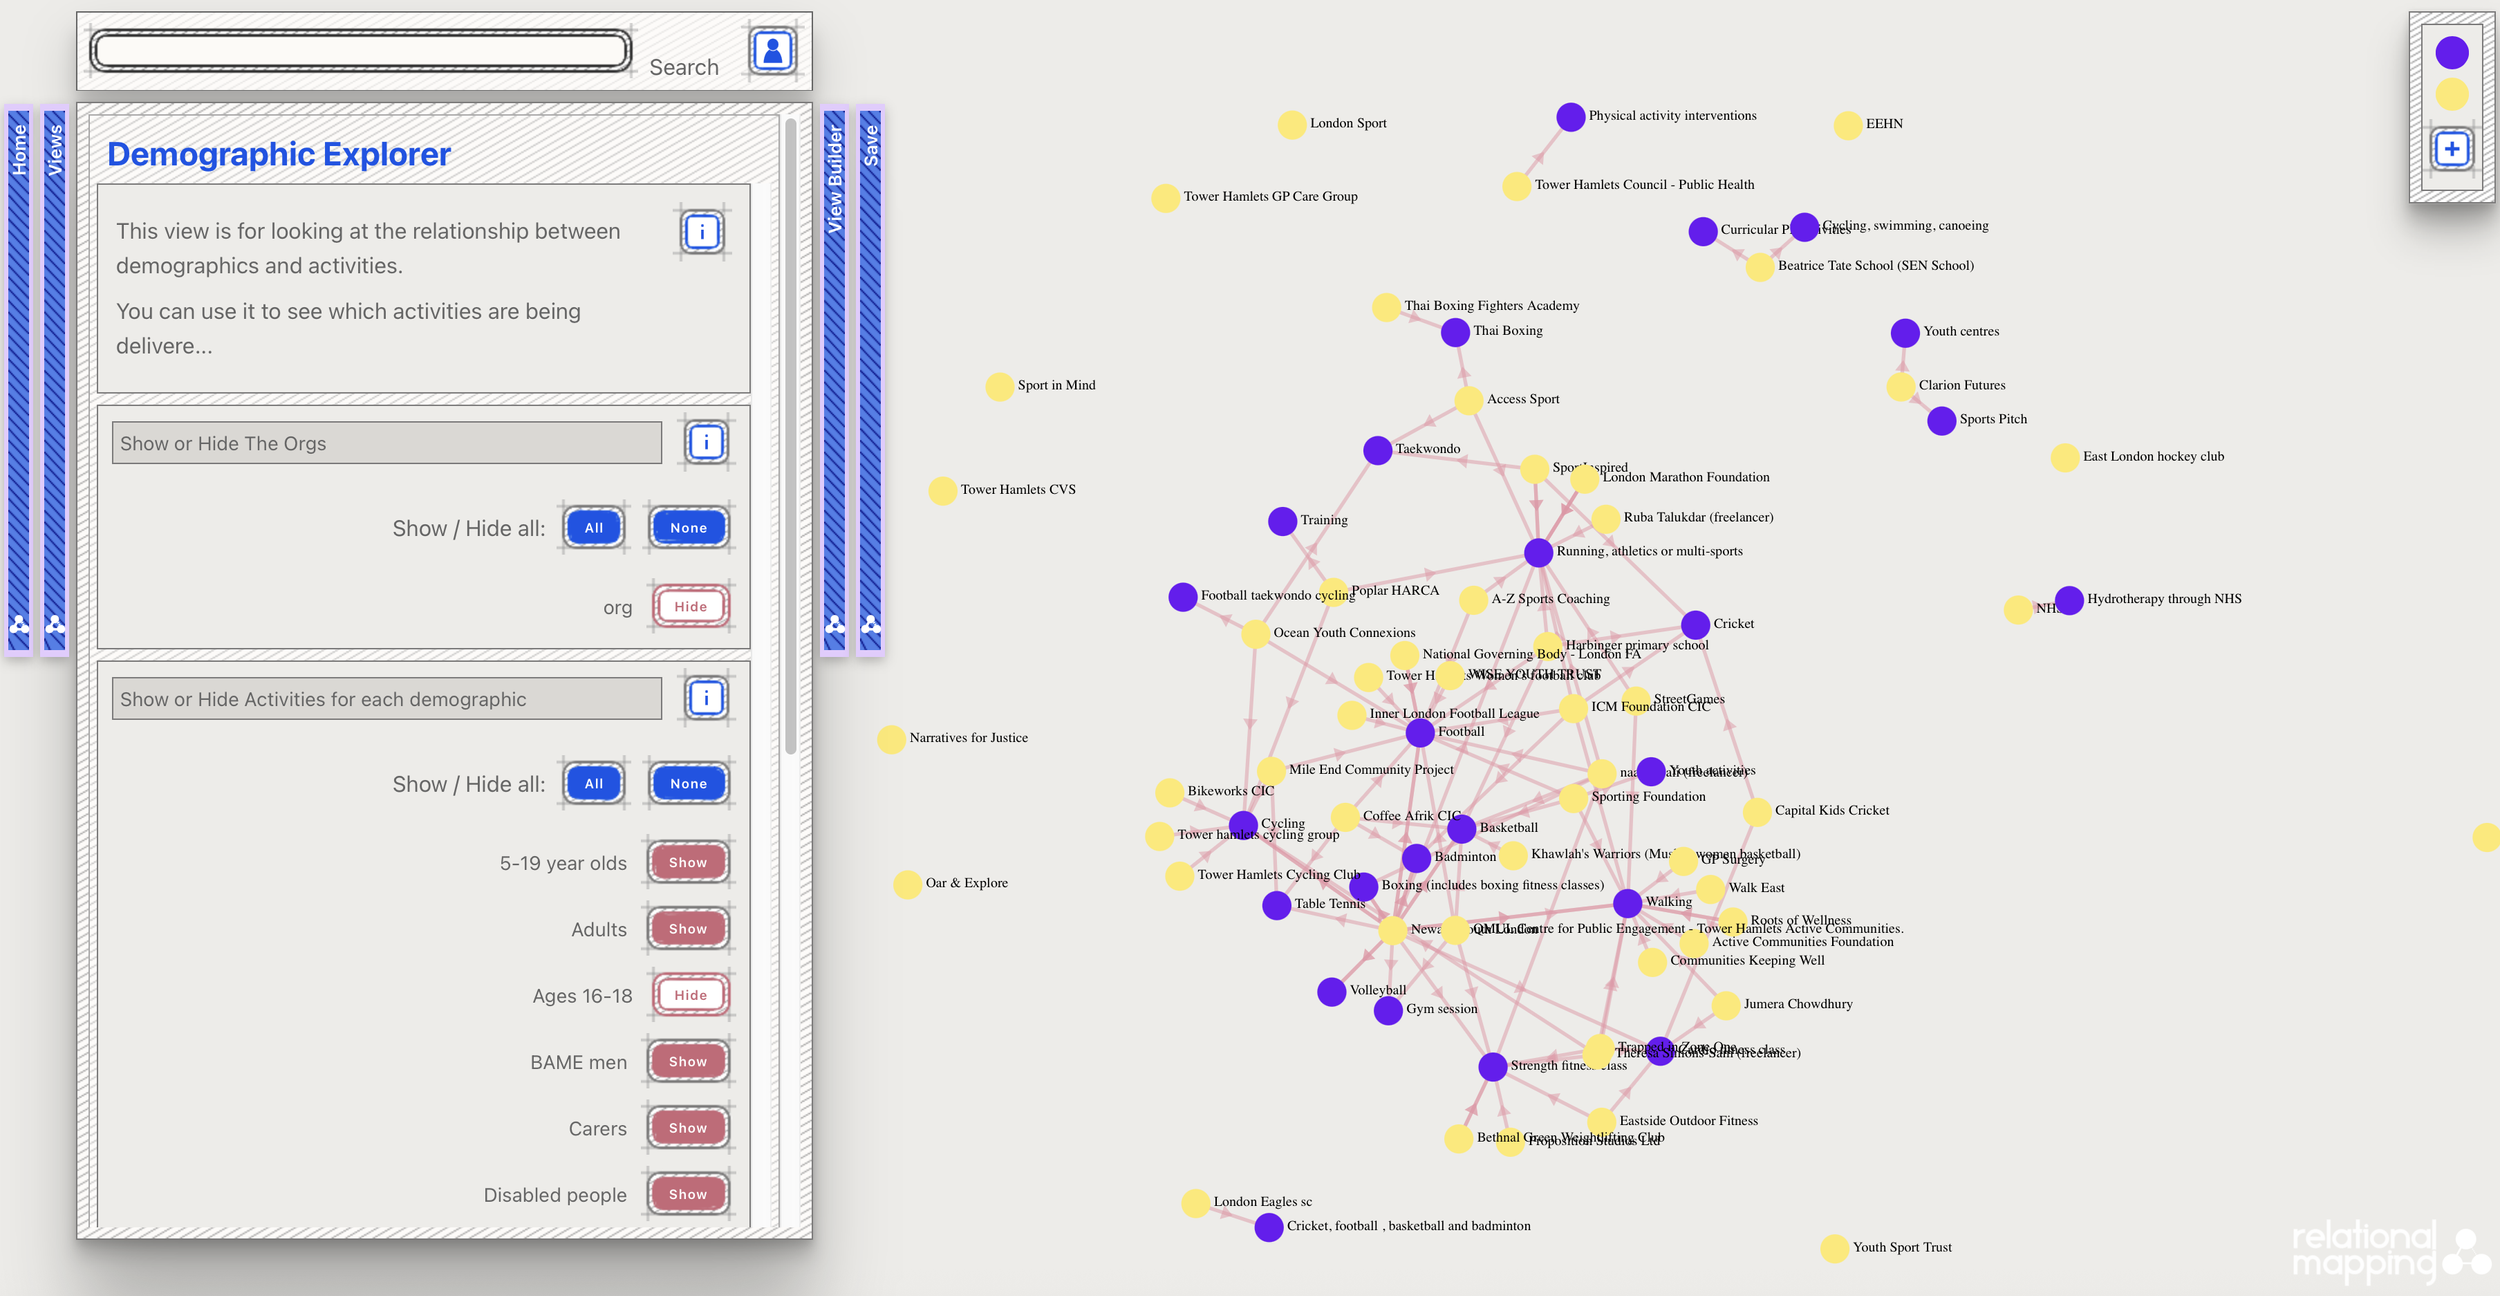
This View is called ‘Demographic Explorer’. For this group of stakeholders delivering sport and physical activity across a London borough, it was useful for the whole community to see who was delivering provisions across different age groups.
Anyone aiming to set up a new activity could look at where the under-served demographics were. This was helpful for funding applications, as well as giving the community insights into where possible collaborations could be made to strengthen the network around demographics. This is helpful for cross-referring, sharing equipment, and spreading scheduling in ways that mean more residents can engage.
Finding hidden potential leaders
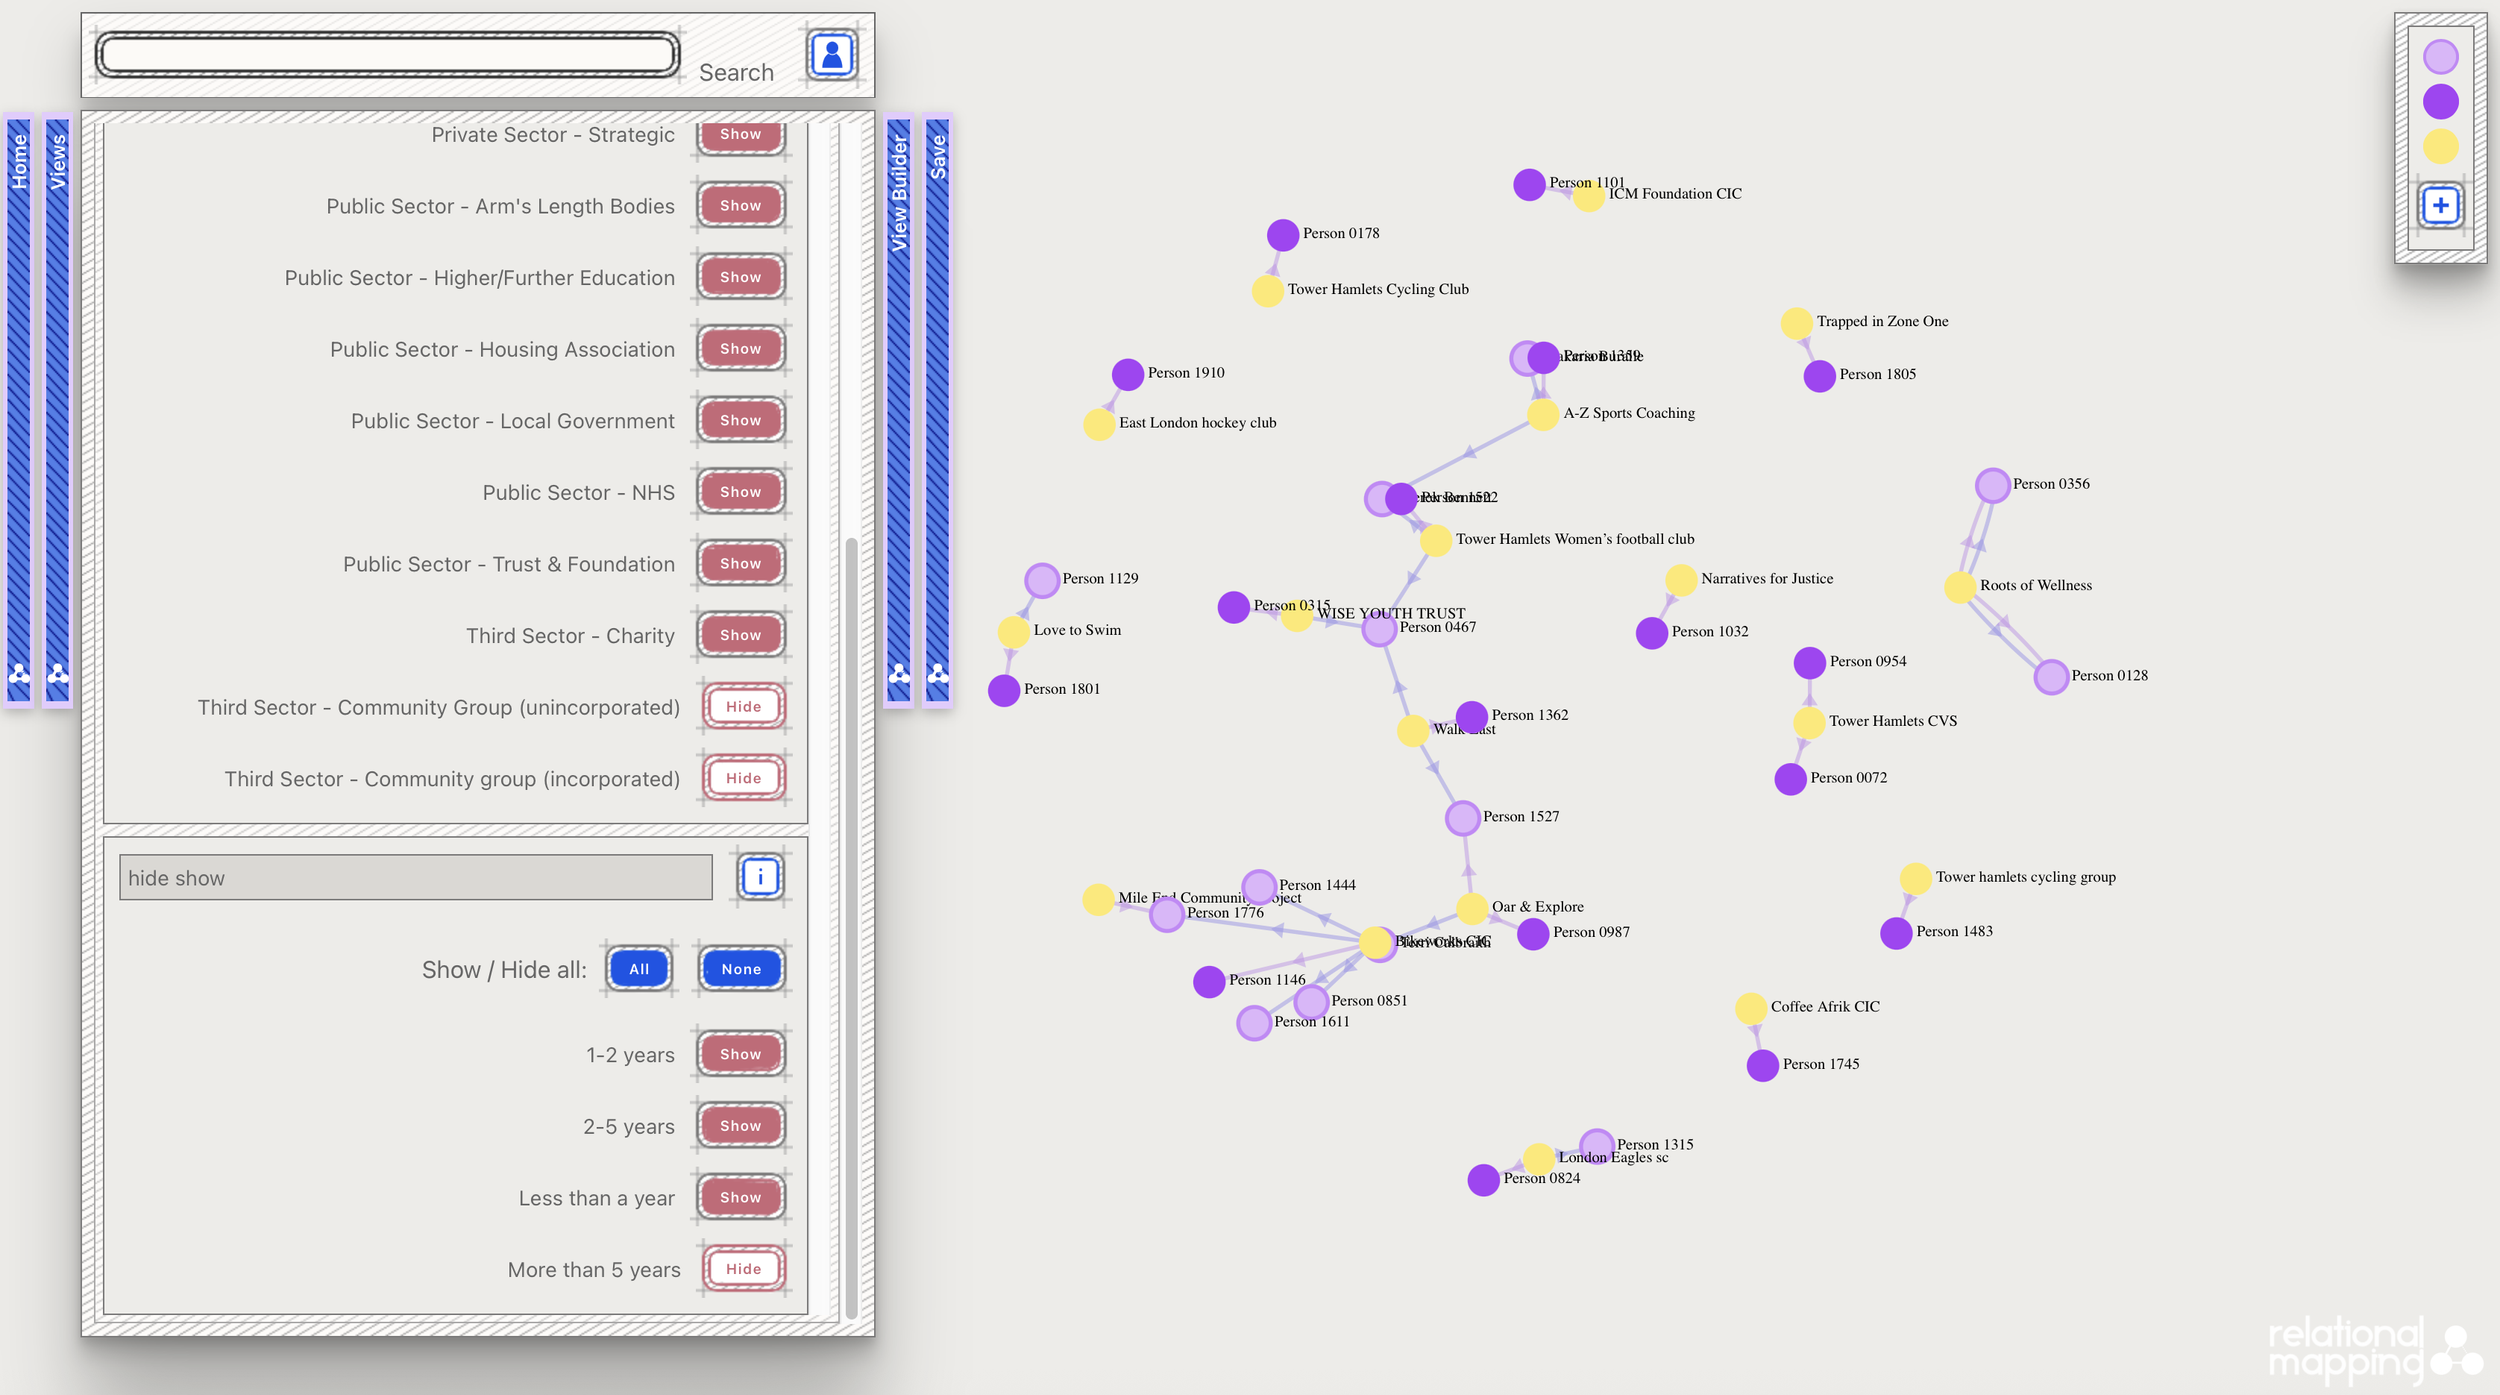
This View reveals the grassroots community groups who’ve been established for more than 5 years and how well networked they are.
It was created in response to the Council, who commissioned the project, wanting to distribute its organising power and build up more empowered local leaders in the stakeholder network. One of the ways to look at this was to ask who, of the community groups, has been delivering in the area for more than five years.
An extra layer of relational nuance is added by looking at who is also supporting their peers.
So in this View, we see who has been delivering for a long time and is relatively stable and well networked with peers and service users. This tells the Council where to begin with nurturing new community leaders.
Clustering knowledge and resources around key provisions
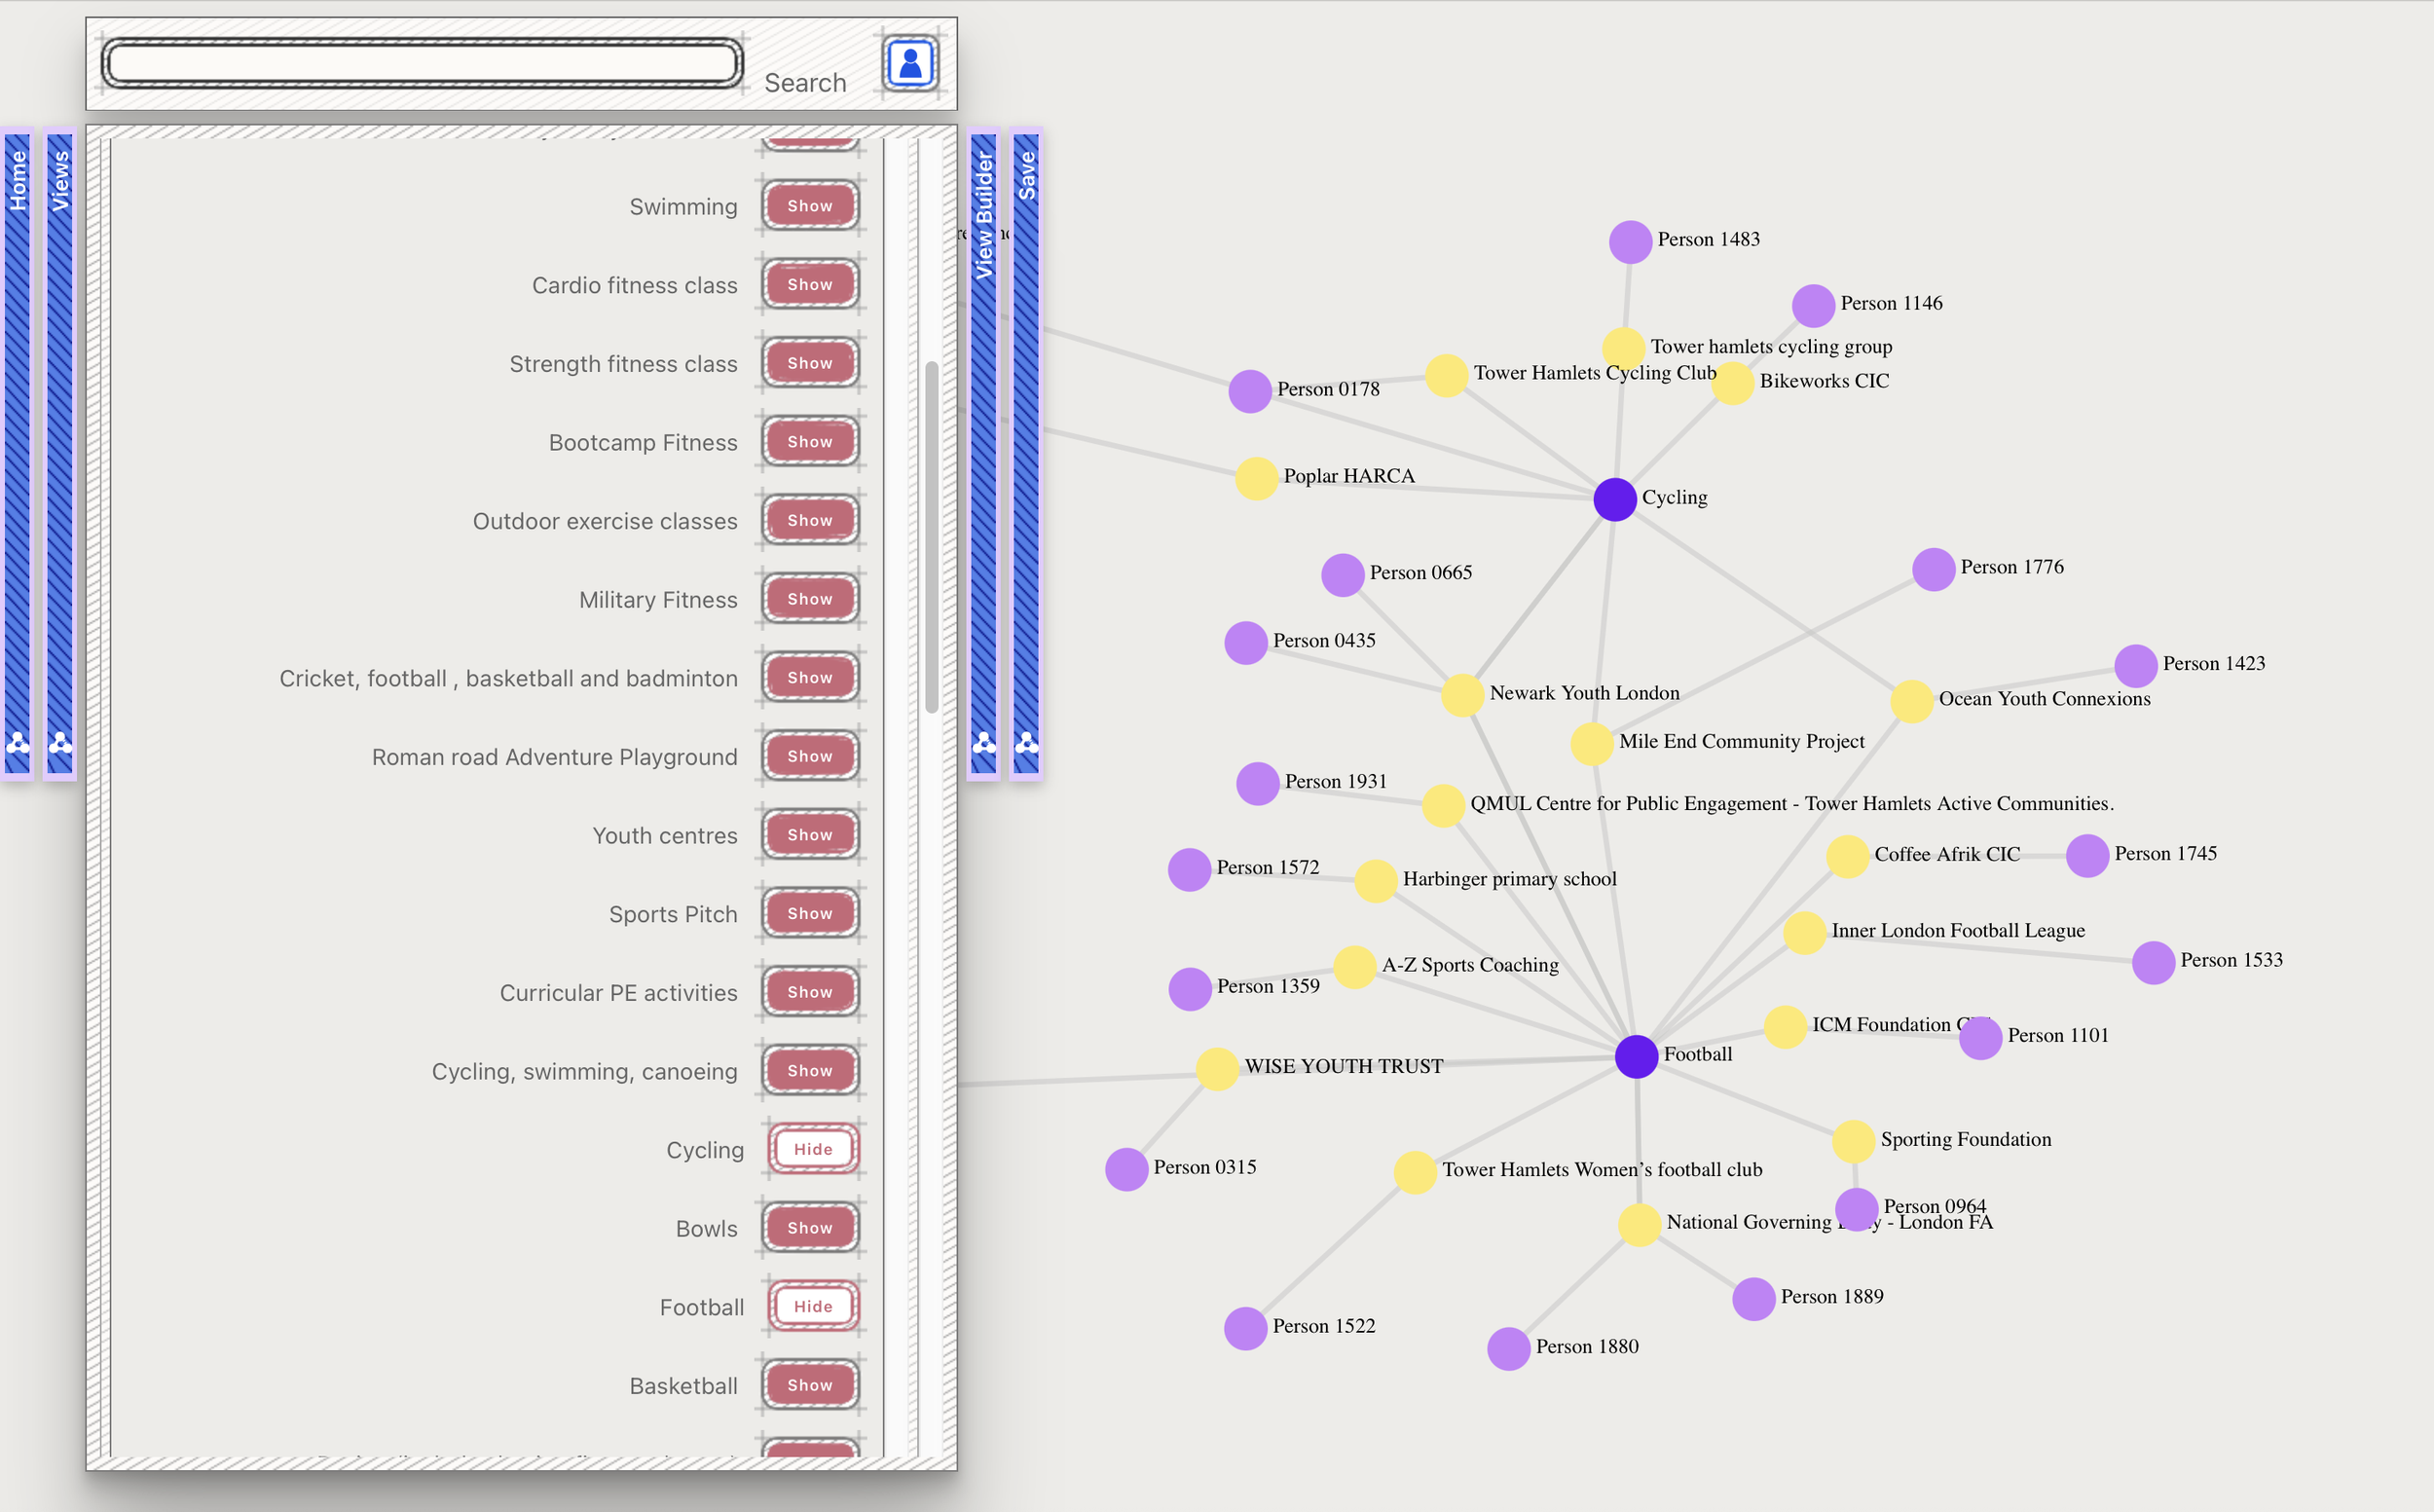
This is another example of a Community View: a View we created to distribute useful insights across the community. It looks at which organisations and people are delivering different types of provision.
We did this by creating a View with filter boxes for each provision type. In this example, we are looking at who is delivering Cycling and Football (and who is delivering both).
A view like this enables all sorts of knowledge, resource and equipment sharing amongst stakeholders working in the same area.
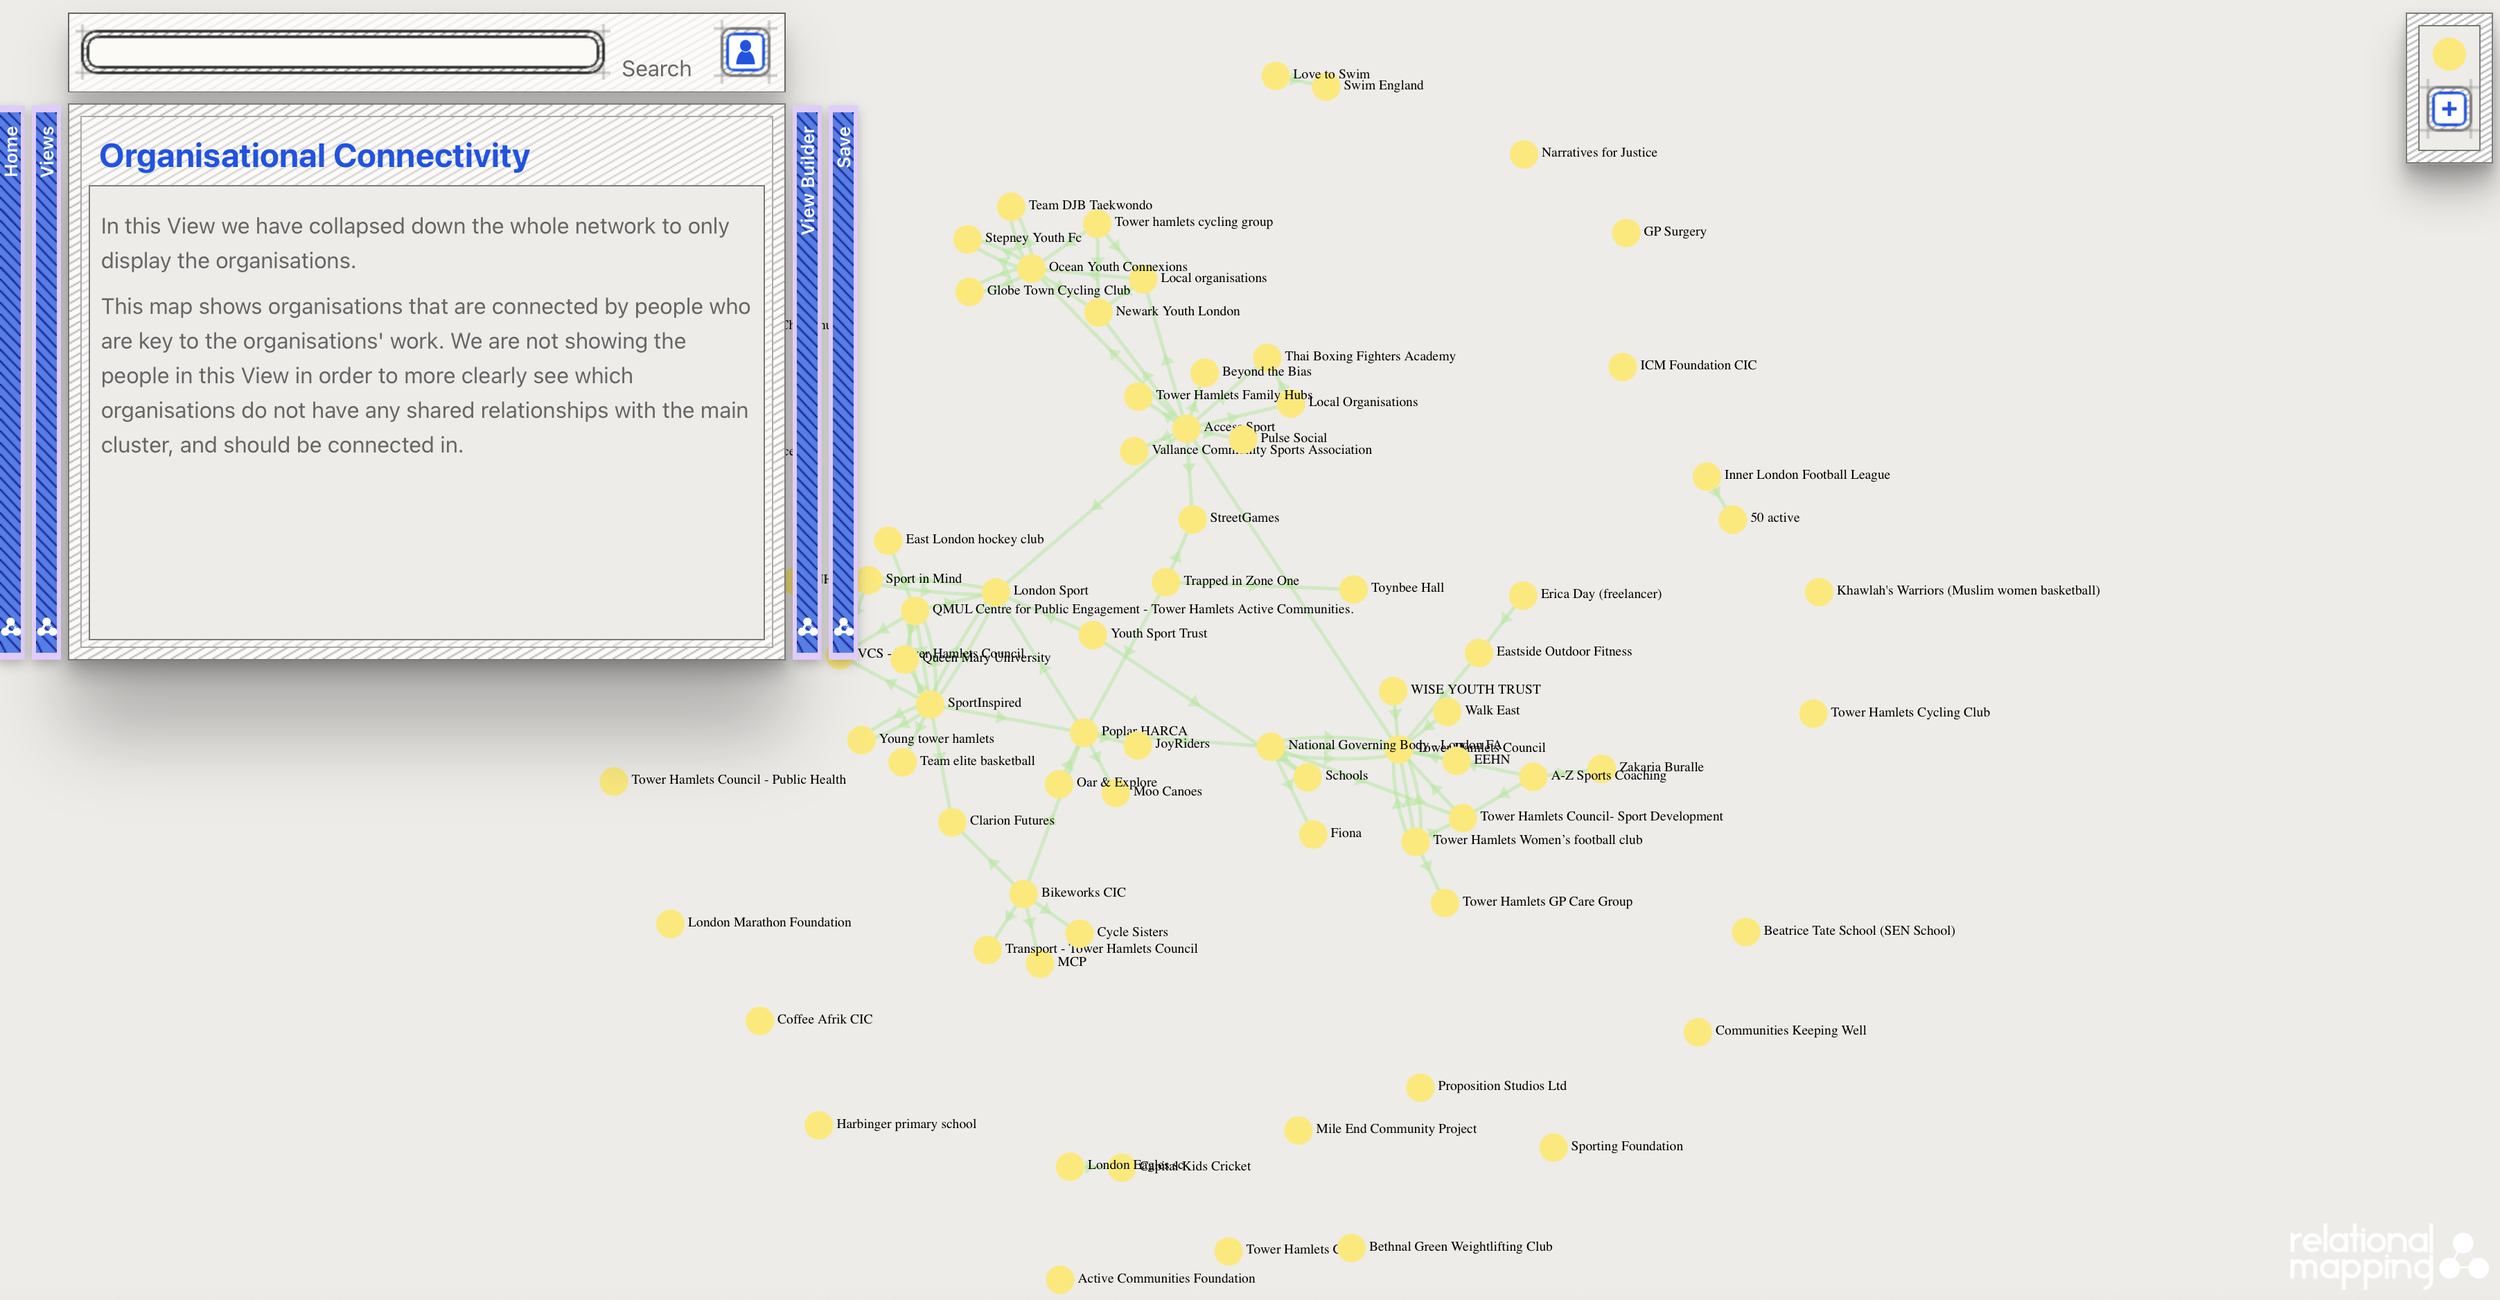
Comparing density of connection: from the Council to the grassroots
This View looks at Organisational connectivity by itself- i.e the organisations that are connected by peer support.
In this community, the main network was very loosely held together with weak ties, and no dense centre of relationships. The periphery had many organisations holding only one connection into the main actors in the network, and lots of further organisations completely isolated from the core network.
Because we had asked about how people’s organisations were constituted and how long they had been established, we were able to see that the Council was holding a good proportion of community together, and that the grassroots organisations were isolated both from the main network and each other- even when they had shared provision or demographic types. This gave our community partners a clear and thorough action plan for building density across the network.
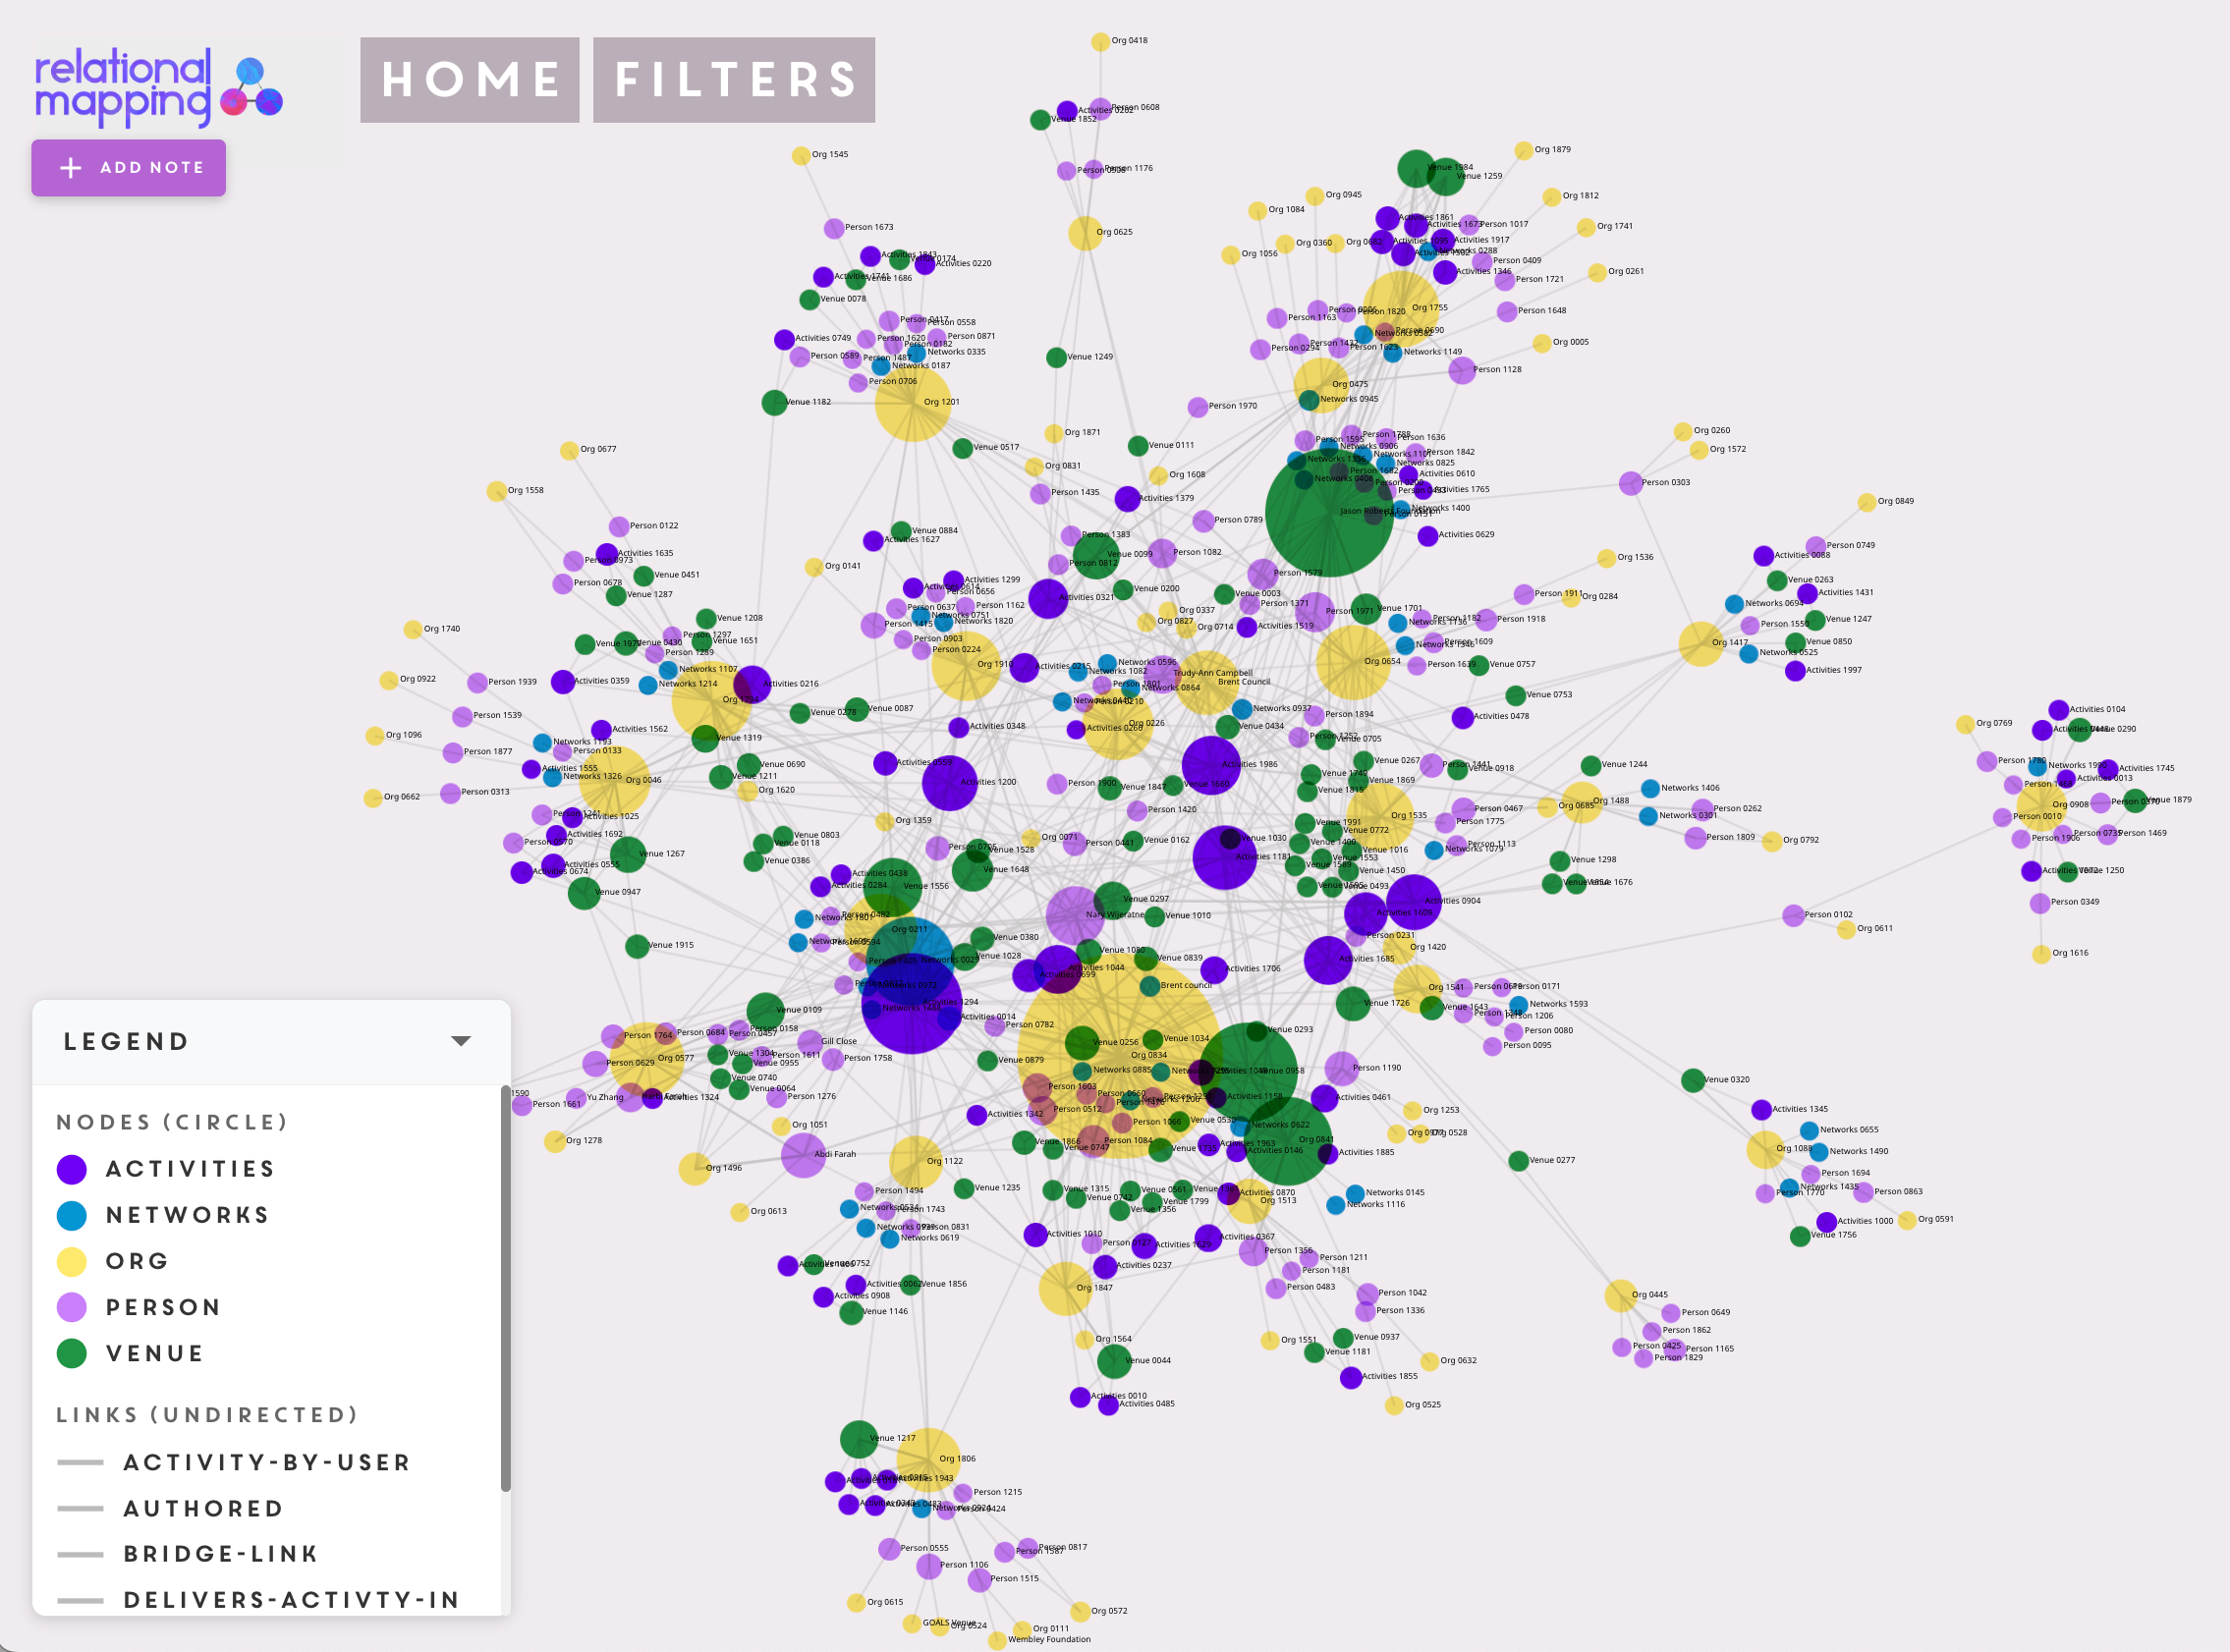
Using Social Network Analysis to explore how integral different organisations are to the community
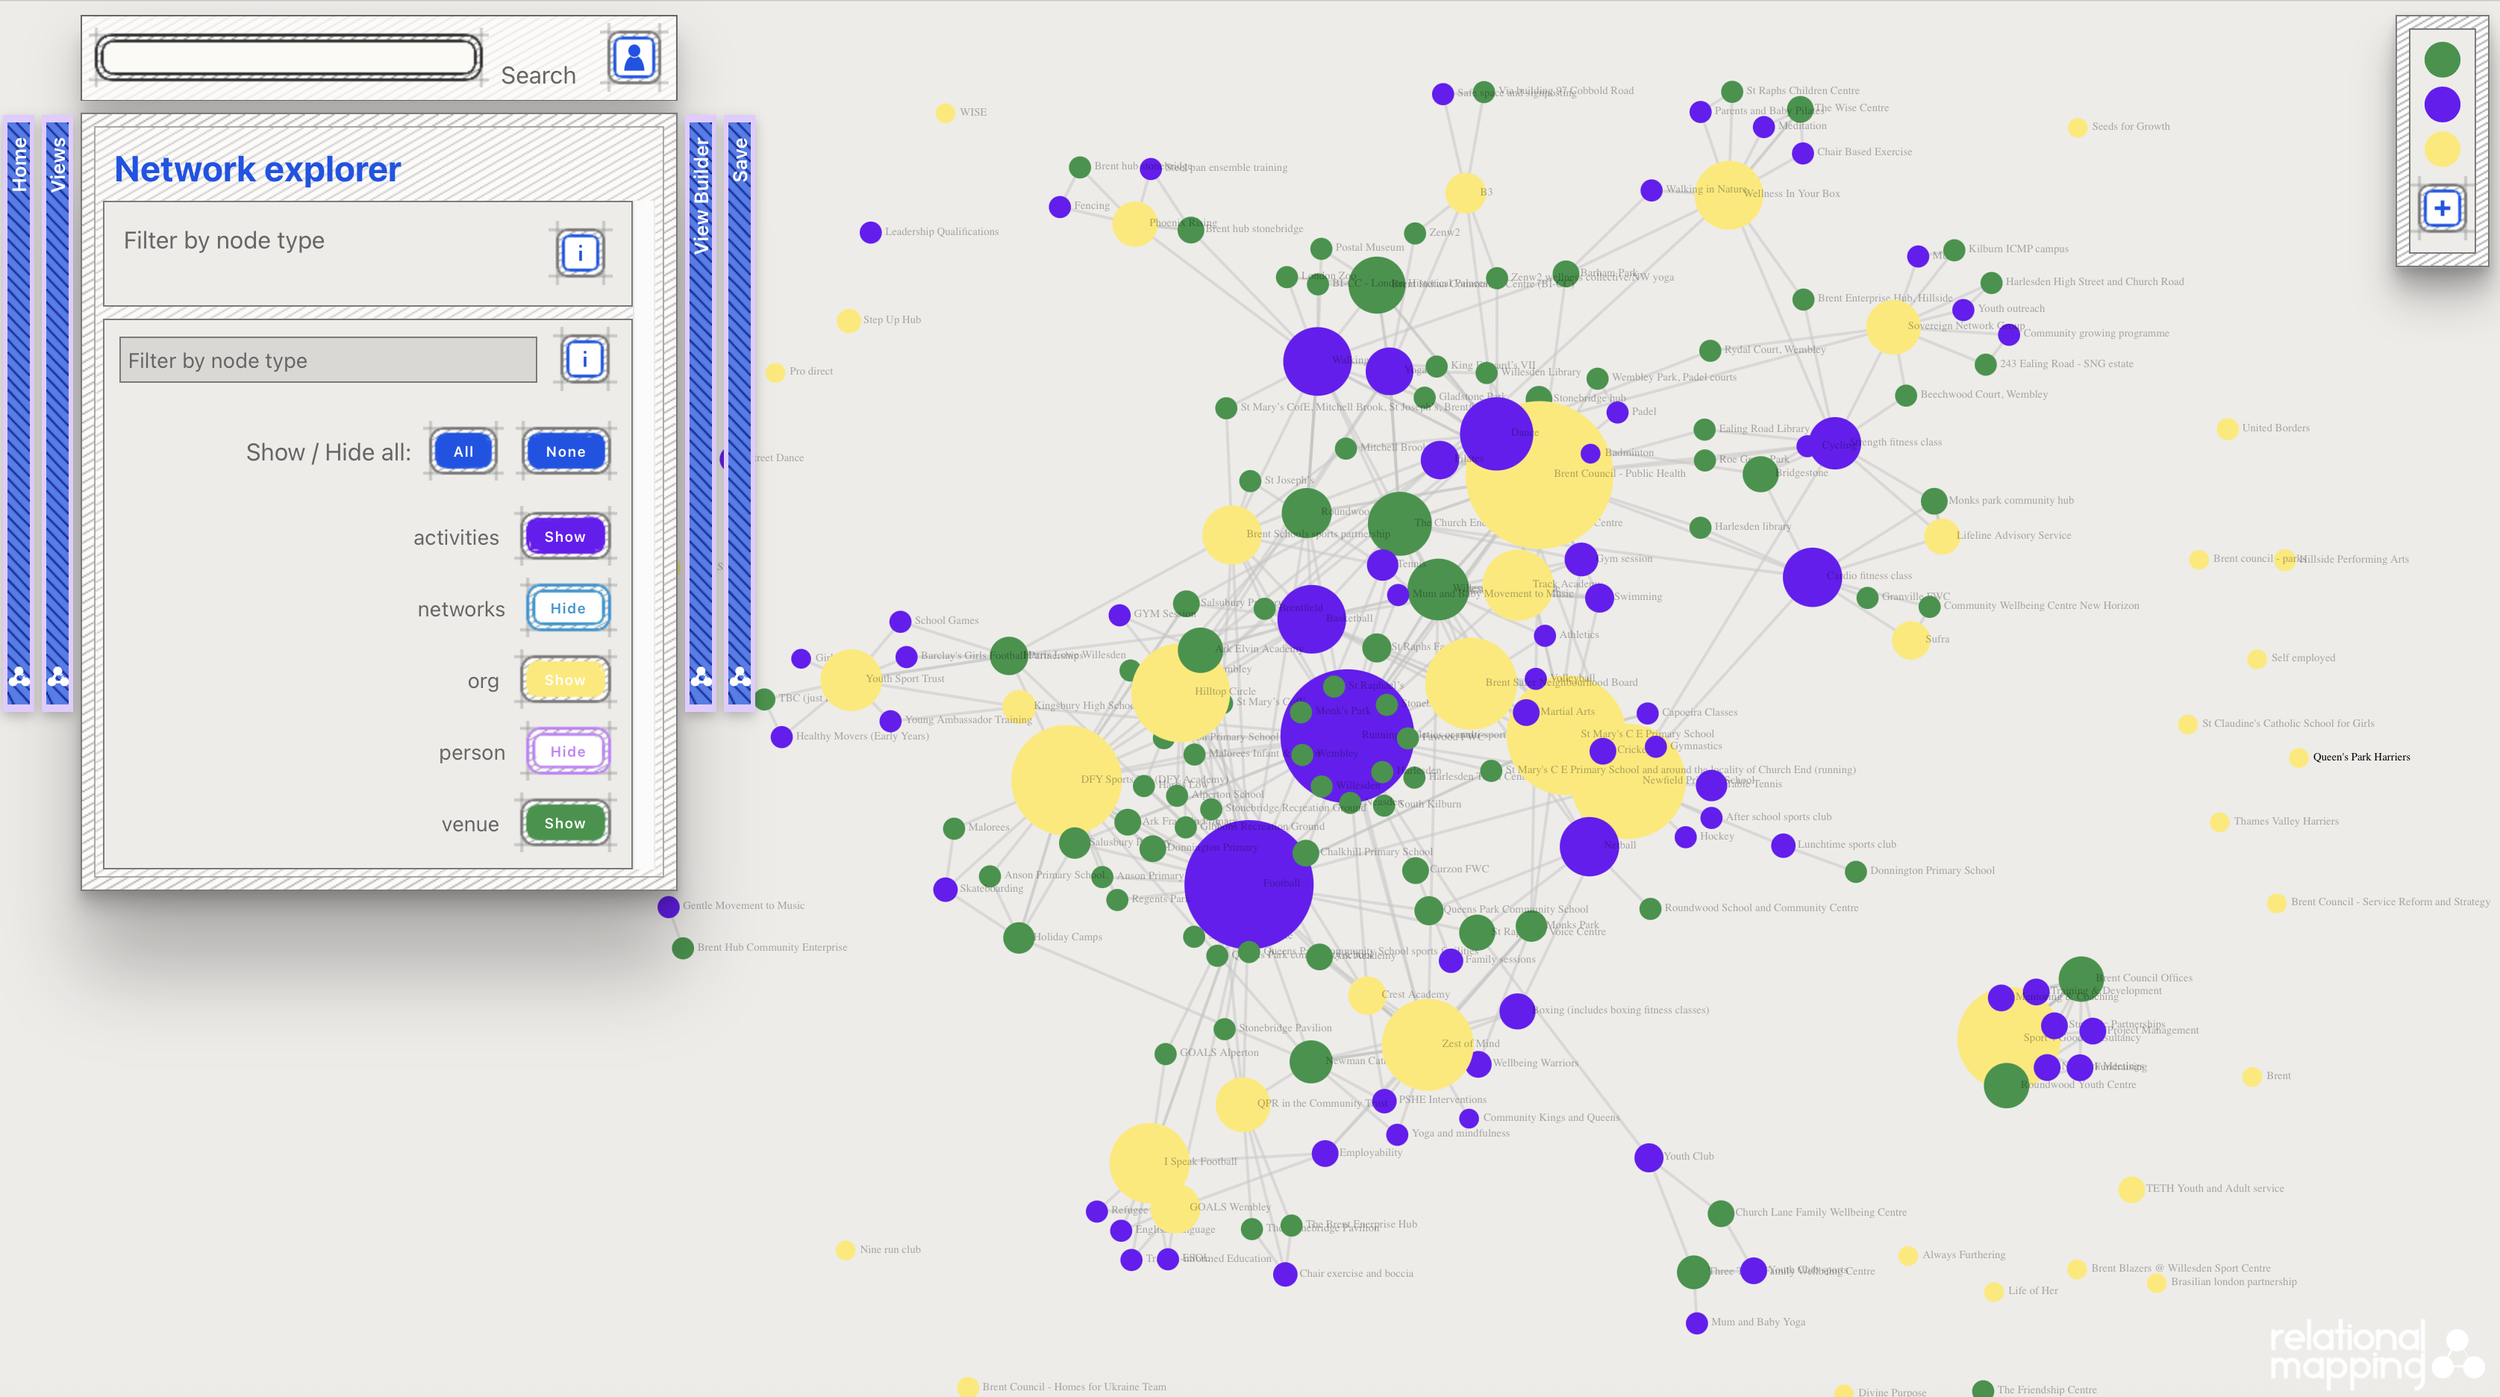
This View is a very flexible set of filters to look at this Stakeholder Network: the organisations, people, venues and activities provided in those venues.
We have used Betweenness /Centrality measures to clearly pick up on which activities, organisations and venues are most active across this large network (the bigger the node, the more connections it has and the more work it is doing relationally to in its part of the network)